TRACS Profitability Dashboard
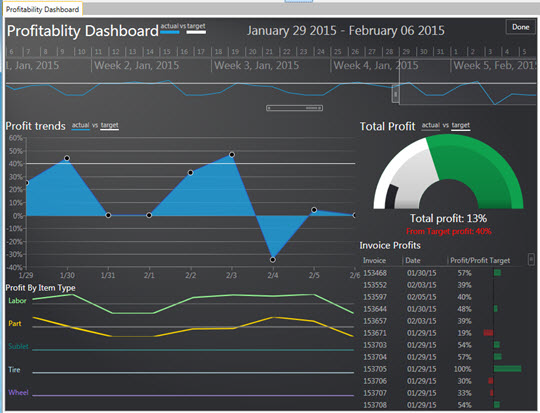
Dashboards often provide at-a-glance views of KPIs (key performance indicators) relevant to a particular objective or business process. The TRACS Profitability Dashboard displays profit trends (actual versus target), profit by item type, invoice profits, and total profit (actual versus target) and uses the work order minimum gross profit % settings for profitability calculations and comparisons.
Accessing the Profitability Dashboard
To access the Profitability Dashboard:
- Click the TRACS Dashboards
 icon from the NAPA TRACS menu bar.
The Profitability Dashboard screen appears in a separate tabbed screen.
About the Profitability Dashboard Interface
This section describes the various parts of the Profitability Dashboard.
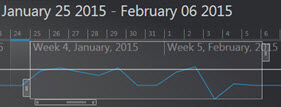
Changing the Weekly Date Range
To display the profitability for a different time frame:
Move your mouse pointer on top of the weekly date range box (white outlined box). The mouse pointer changes to a hand.
Left click, drag, and then release the mouse click.
- Click the Done button to close the dashboard.
Increasing and Decreasing the Date Range
To increase or decrease the date range box:
- Hover your mouse pointer over the bars
 located
to the top-right corner and left-bottom corner of the date range box.
The mouse cursor changes to a double-arrow.
located
to the top-right corner and left-bottom corner of the date range box.
The mouse cursor changes to a double-arrow. - Click and drag to the left or right.
- Click the Done button to close the dashboard.
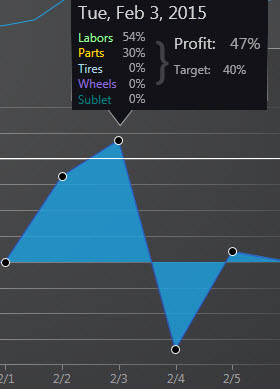
Viewing Profit Trends Snapshot
To view a snapshot of profit trends from the graph:
- Hover you mouse pointer on any of the round circle indicators on the graph. The system displays a snapshot of profit trends for that particular date.
- Click the Done button to close the dashboard.
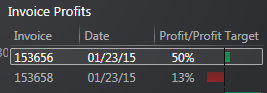
Viewing Invoice Profits
To view an invoice listed in the Invoice Profits section double-click on a row.